black and white bed linen

Trade with Confidence

Empowering traders with cutting-edge indicators and strategies for navigating commodities futures markets effectively.

Empower Your Trading

Empowering traders with actionable strategies for commodities futures markets.

A hand is holding a smartphone that displays a stock market chart with various candlestick patterns and horizontal lines. The phone is held against a textured fabric background, which appears to be a sofa or carpet.
Trade Confidently

Our tools and education help you navigate the commodities market confidently, whether you're a novice or an experienced trader seeking to refine your strategies and enhance your trading edge.

A laptop displaying a stock market graph with a rising trend is placed on a desk. Next to the laptop are several books stacked on each other, with titles related to investing. A mouse is positioned to the right of the laptop.
Actionable Strategies

Discover cutting-edge indicators and strategies designed to empower traders of all levels, enabling you to trade effectively and make informed decisions in the dynamic commodities futures markets.

Indicators

Empowering traders with actionable strategies for futures markets.

A close-up view of a financial newspaper page showing stock index performance. It includes flags indicating countries such as the United States, Canada, and Brazil alongside their respective stock indices like Dow Jones and S&P 500. Figures show numerical values and percentage changes, some in red indicating a decrease and some in green for an increase.
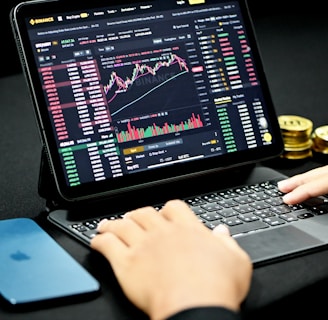
A person is typing on a laptop keyboard while looking at a cryptocurrency trading platform displayed on a tablet screen. Charts and price data are visible. Nearby is a smartphone and a stack of gold coins on the desk.
A laptop and smartphone are placed on a wooden table. Both devices display financial charts and data, suggesting involvement in stock trading or market analysis. The setting appears to be indoors with natural light coming through a window.
A wooden table holds an assortment of objects including two potted plants, an alarm clock, a pair of markers, a tablet displaying a book, a small white electronic device, and a glass of dark liquid. The tablet's screen shows the title 'The Handbook of Technical Analysis'.
A digital stock market ticker displaying the SPY index value at 452.65, alongside a graphical representation of market performance with green and red indicators. The numbers 2.16 and 0.48% suggest a percentage change. The image uses bright LED-like dots for visual impact against a dark background.